Salt River Power Station
Salt River 1 was the first coal-fired power station to be both built and operated by ESCOM. At the time of making the extensions in 1932-33, it was the first power station in South Africa to operate at a steam pressure of 425lb/sq.in. [3,0MPa (abs)] and a temperature of 750°F [399°C] at the boiler outlet. The previous maximum pressure had been 300lb/sq.in. [2,17MPa (abs)]. Salt River 1 was also the first outside of Great Britain to generate at a voltage of 33kV. At the time of commissioning Salt River 2 in 1955, the boiler steam temperature of 915°F [491°C] was again the highest of any power station in South Africa.
Note: Witbank Power Station, which was financed and owned by ESCOM, started operating in May 1926. It was the first entirely new coal-fired power station to be started since the establishment of ESCOM, but it was designed, built and operated by the Victoria Falls and Transvaal Power Company Limited on behalf of ESCOM. Colenso Power Station was taken over by ESCOM in January 1927, but the station had been built and originally commissioned by the Railway Administration. (Troost & Norman 1969:182; ESCOM Golden Jubilee 1923-1973:14)
As demand in the Western Cape increased, Salt River 2 was extended until it had an installed capacity of 240MW in 1967. At that stage it was decided to meet future growth in load from a national grid, which was then under construction, generating electricity from power stations built at the coalfields. A site for the erection of a nuclear power station, approximately 28km from Cape Town, was also purchased in July 1967. The Western Cape became linked up to the national grid on 7 October 1969 and generation at Salt River was substantially reduced after 1970. The first unit at Koeberg Nuclear Power Station was commissioned in July 1984. The formal closing ceremony for Salt River 2 Power Station was held ten years later, on 12 August 1994. The main switch-house was then converted into a sub-station and continued to supply power to the Railways and Harbours, as mandated in 1925. During a period of almost 67 years, from February 1928 to August 1994, Salt River 1 and 2 stations sent out 29 693GWh (gigawatt hours) or 29 693 million units of electricity and burnt 16,5 million metric tons of coal. (ESCOM Ten Years 1923-1933:17-18; ESCOM Golden Jubilee 1923-1973:36; ESCOM Annual Reports 1969:8, 1984:17 and Tables of Power Station Operating Statistics)
THE COUNCIL, THE RAILWAYS AND ESCOM
1908-1910: Cape Town City Council agrees to supply Government Departments
The Cape Town City Council (the Council) had a power station in operation at [the old] Dock Road, which was opened on 14 April 1904. Prior to 1909 the Railways had a number of moderate-sized, for that time, power stations at various centres in the country for their workshop needs. In Cape Town they had their own generating plant for charging train lighting accumulators, lighting for the Cape Town Railway Station and the Salt River Workshops, and power for the workshop machinery. The Harbour Board also had a power station in the Docks. During 1908 an agreement was drawn up between the Government and the Council whereby the Railway Administration and the Harbour would take electric power in bulk from the Council. The agreement was for a term of 15 years, commencing from 1 July 1909, with a minimum guaranteed annual consumption of 1,250GWh. (Energy actually purchased from 1 July 1909 to the end of the year amounted to 0,588GWh). In order to meet the requirements of the Railway and Harbour Departments, the Council installed two 400kW two-phase alternators at Dock Road. These were the first alternating current machines installed by the Council.
[The first turbine driven alternators at the Council’s Dock Road Power Station were installed in 1913 and 1914. The power stations of the Harbour Board, built in 1891 and another in 1902, should not be confused with the Council’s Dock Road Power Station commissioned in 1904. The building of the Harbour Board power station erected in 1902 was still in existence in 2004, close to the Maritime Museum, in what became Dock Road under the V&A Waterfront development. More than a century after being built, and with the engine room crane still in position, it became the “Dock Road Theatre” and later the “Compact Disc Wherehouse”. The Council’s Dock Road Power Station was demolished in 1962 and stood approximately where Lower Long Street has been built. The Council’s Table Bay Power Station, adjacent to it, was demolished in 1988-89. That portion of the original Dock Road where the Council power stations existed has been remade and renamed as Hans Strijdom Avenue.] (Cape Town Mayor’s Minutes year ending 17 Sept 1908:42; Annual Report of the City Electrical Engineer year ending 30 June 1909:(i), 30 June 1910:(iv), 31 Dec 1913:(iv); Pask 1922:421-426; Shorten 1963:305; Palser 1895-1995:21&28) 1912-1920: Railway Electrification Proposals and Merz and McLellan Report of 1919
Charles Merz (later Dr) arrived personally in Cape Town on 16 August 1919. His visit was to have been earlier, but the Government of Great ritain could not spare him sooner from his advisory duties there. Travelling in Sir William Hoy’s private saloon, Mills conducted him over all the lines reported on. The report was laid before Parliament during the special session of September 1919. In this report Merz and McLellan suggested that a power station be built at Cape Town, initially with four 8MW sets and with a further four sets being added when the main line to Touws River was electrified. The report also suggested a power station be built at Durban consisting of four 8MW sets and another on the Buffalo River near Glencoe consisting of three 8MW sets. A White Paper was laid before Parliament in June 1920, in which it was recommended that funds be voted immediately for the electrification of the Cape Town-Simonstown suburban line and the Durban-Pietermaritzburg main line. Parliamentary authority was given, but due to the serious financial situation, it was decided to postpone electrification of the Cape Town-Simonstown line. (Annual Reports of the General Manager of Railways and Harbours presented to Parliament 1912:22 [UG 46-1913], 1914:32 [UG 25-1915], 1917:10 [UG 43-’18], 1918:9 [UG 59-’19], 1919:11 [UG 66-’20]; Merz and McLellan 1919:(v)-(vi) & Table IX; Mills 1919:737-8; Sir William Hoy 1922:358; Pask 1926:90-92; Lydall 1928:1021-2; Christie 1984:78-79) 1921: The Railways select sites for Power Stations on the Tugela and at the Salt River Mouth
(Annual Reports of the General Manager of Railways and Harbours presented to Parliament 1920:7 [UG 42-’21], 1921:10 [UG 37-’22], 1922:21 [UG 40-’23], 1923:6 [UG 43-’24]; South African Railways and Harbours Magazine, May 1922:350-353, May 1923:416, Nov.1924:1087; June 1926:766; ESCOM Annual Report 1923:8-9; Lydall 1928:1021-2)
Extensive use of steel sheet-piling was necessary below ground level as the site was only 11 feet [3,3 m] above the sea’s low water of ordinary spring tide (LWOST). A pumping system cleared groundwater during construction of the cooling water canal and other underground works. The basement of the circulating water pump house was 13,5 feet [4,1 m] below LWOST (D Fowler 2001). The floor area of Salt River 2 was approximately 80 000 square feet [7 400 m2], and the height of the building was 130 feet [39,6 m]. By March 1954 one of the two 300-foot [91 m] chimneys had reached a height of 200 feet [61 m], and the foundations of the other had been laid. The base diameter of the chimney was 20 feet [6,1 m] and each would have used, when complete, an estimated 900 000 bricks (The South African Electrical Review, March 1954).
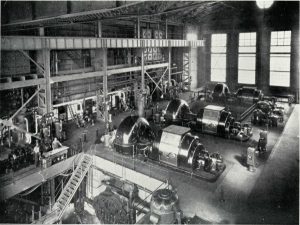
Delays in the delivery of the boilers, the largest ever installed in the Western Province, led to delays in construction on site, with the result that the first boiler was placed in service only by November 1954 (ESCOM Annual Report 1955). This initially fed steam to Salt River 1 via a pressure reducer and de-superheater. The inter-connector could pass sufficient steam to supply a 20 MW generator at full load, and was extensively used for the remaining life of Salt River 1 (D Fowler 2001). By the end of 1954 a further two boilers and the first generator were in an advanced stage of construction (ESCOM Annual Report 1955).
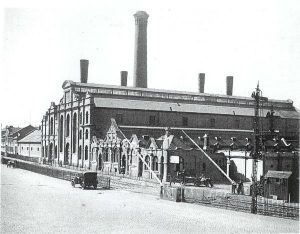
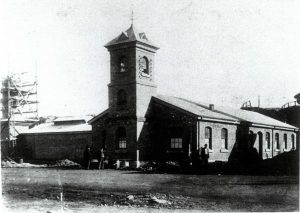
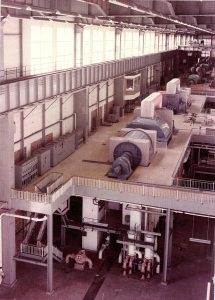
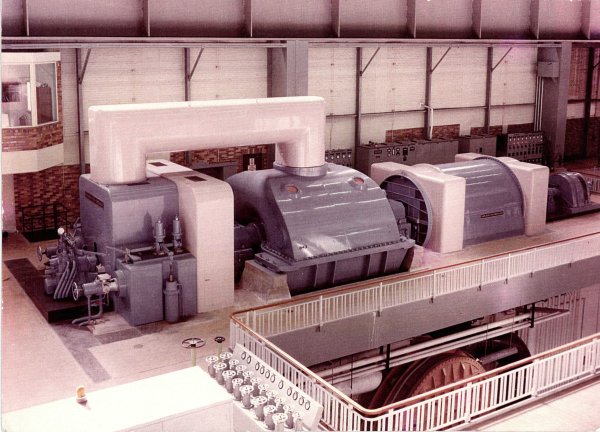
Salt River 2 under construction (1954). The building for the 33 kV switchgear control room and offices is on the left, in the first view. The second view is taken from the coal yard.
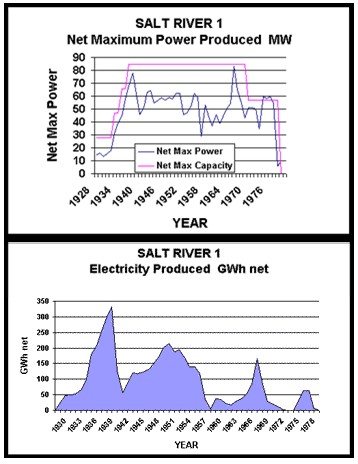
After the 20 MW sets were commissioned, Salt River 1 began exporting a considerable amount of power to the Council. In 1933 net generation was over 100 GWh, and with its higher thermal efficiency it became the base load station for the “pool”, while the Council’s Dock Road provided back-up in case of break-downs and peak-time coverage. Thermal efficiency in 1936 was 21,7%, which was the highest during the operating life of the station. The year of maximum generation at Salt River 1 was 1938, when electricity sent out amounted to 333,6 GWh (of which 239,4 GWh was supplied to the Council) and maximum power produced was 78 MW. From 1939 Table Bay provided the base load, and the electricity sent out from Salt River fell to 129,2 GWh in 1939 (about 121% of the ESCOM system sales) and maximum power produced was 62 MW. In 1940 the figures had dropped further to 57,6 GWh (only 48% of the ESCOM system sales) and 46 MW respectively. Salt River continued to act as the back-up station during the years of World War II (1939 to 1945) sending out 131,3 GWh in 1945, almost 80% of the ESCOM system sales, but only 22,7% of the whole system’s power (ESCOM Annual Report 1945:29).
As the new plant at Hex River Power Station in Worcester (from May 1952) and at Salt River 2 (from April 1955) came on line, running hours at Salt River 1 were reduced (ESCOM Annual Report 1956:27). Salt River 2 became the base load station for the Undertaking, particularly after the termination of the Pooling Agreement in 1957 (ESCOM Annual Report 1957). Net generation at Salt River 1 was only 4 GWh in 1957 and 55 GWh in 1964. But due to a breakdown of a generator at Salt River 2 at the end of 1965, Salt River 1 was required to generate as much as possible during peak periods. The old low pressure boilers, which had been mothballed for eight years, were recommissioned (ESCOM Annual Report 1966:22). As a result, generation increased to 165,2 GWh for 1966 (12% of the ESCOM system sales). During the years 1971 to 1973 generation was almost zero, but increased again from 1974 to 1976 (62,2 GWh in 1975) due to a general shortage of power on the [then] interconnected national power system. When the position improved in 1978, internal consumption exceeded generation and it was decided to decommission Salt River 1.
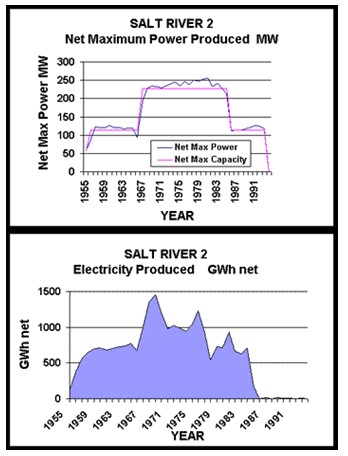
Generation at Salt River 2 peaked in 1968 and 1969 before the Cape Western Undertaking (the name changed from Cape Town Undertaking on 1 January 1949) drew electricity from the pooled stations of the Rand and Orange Free State Undertakings. This significant event took place on 7 October 1969 when the 400 kV transmission system linked up at the Droërivier Distribution Station near Beaufort West (ESCOM Annual Report 1969:8). Maximum generation at Salt River 2 was in 1969, when a net amount of 1 458,7 GWh was sent out, which was 78% of the electricity used in the Cape Western Undertaking (ESCOM Annual Report 1969). When the Central Generating Undertaking (the CGU) was established on 1 January 1972, all ESCOM power stations including Salt River, were transferred to this entity and management and control of the power station then no longer fell under the Cape Town office. Establishment of the CGU enabled ESCOM to obtain the maximum advantage from pooling (Conradie & Messerschmidt 2000:142). Because coal costs at the stations near to the pit-heads were very much lower and it was more economic to import power via the 400 kV system, by 1978 Salt River 2 supplied only 550 GWh. This was less than 10% of the energy needs of the Cape Western Undertaking. The figures increased again in 1981 to 933 GWh or 13% of the requirements in the Cape Western Undertaking, due to shortage of plant up country, but in 1985 net generation was only 175 GWh. In 1986 and again in 1988, internal consumption exceeded generation. During the five years 1989 to 1993 the annual energy sent out was only about 10 GWh. The station was decommissioned in August 1994. (ESCOM Annual Report 1969:8; Conradie & Messerschmidt 2000:142).
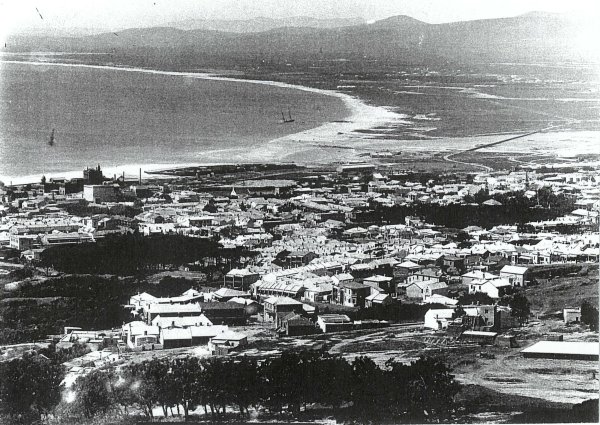
| Views of Salt River 2 from the beachfront. Salt River 1 is on the left. The entrance building (1928) and the two wings of the 33 kV switch house can be seen on the right. Both of these still remain. The switch house has been converted into a sub-station. Devil’s Peak and Table Mountain are in the background. In the foreground is the circulating water outlet to the sea. |
| Salt River 2 often produced a net maximum power of 10% above rated capacity. The highest net maximum power produced was 256 MW in the year 1981, which was 112% of the rated net maximum capacity of 228 MW. This achievement was in part due to Salt River 2 having extra boiler plant. However, as a result of surplus power on the ESCOM system, half the power station was “mothballed” in 1986. Some of the larger and more efficient power stations were completely mothballed shortly after (Conradie & Messerschmidt 2000:260), but the 60 MW sets at Salt River 2 were kept operational to provide stand-by off-site power for Koeberg Nuclear Power Station, if required. On occasions that the station was run for national requirements, the net maximum power produced by this “non-mothballed” plant was still approximately 10% above rated output (Conradie & Messerschmidt 2000:260; D Fowler 2001). |
Coal was railed to Salt River from various coalfields in the Witbank area. During the 1960s and 1970s it was often railed to Maputo or Richard’s Bay and then shipped to Cape Town, where it had to be loaded into trucks again to be brought to site. The use of shipping was a Railway arrangement in order to relieve the congestion on the main line. Before the construction of the coal tipplers for Salt River 2, the coal had to be off-loaded manually via off-loading pits. A fireless locomotive, charged with steam and water from the low-pressure steam range, was first used for shunting coal trucks. A steam locomotive, and also a diesel replaced this. (D Fowler 2001).
During the early years of Salt River 1 very high quality coal, chiefly “peas” 1/4 inch to 3/4 inch [6 mm to 19 mm] of high calorific value over 13 100 Btu/lb [30,5 MJ/kg] was received (ESCOM Ten Years 1923 to 1933: 51 &ESCOMTwenty-five Years 1923 to 1948: 42). The calorific value decreased over the years from above 30 MJ/kg before 1940 to 29 MJ/kg by 1950, 28 MJ/kg by 1954, 27 MJ/kg by 1960, and after 1975 sometimes below 26 MJ/kg. The lowest annual figure was 23,96 MJ/kg in 1977 (ESCOM Annual Reports). Between 1946 and 1951 the ESCOM Annual Reports mention 1) the “precarious” state of coal stocks at Salt River, 2) that full requirements of “pea coal” were not supplied and “round coal” [above 35mm], which needed crushing locally, had to be resorted to (ESCOM Annual Report 1946:35), and 3) that coal prices continued to rise. The shortage of reserves in 1948 was “an extremely serious problem” (ESCOM Annual Report 1948:34) and in 1951 reserves were at times “almost nil” (ESCOM Annual Report 1951:29). In 1955, 1964 and 1965 coal stocks were again extremely low (ESCOM Annual Reports 1955:26, 1964:21, and 1965:21).
The contracts for Salt River 2 specified that the boilers were to be designed for “mixed smalls” (0 to 25 mm), the higher quality peas being reserved largely for export. The mixed smalls supplied often contained 50% of “duff” (below 3 mm down to powder) which could create blockages and combustion problems with the chain-grate stokers. This sizing of coal was vulnerable to spontaneous combustion, as occurred in 1959 and 1966. The resulting smoke caused a traffic obstruction on the adjacent N1 freeway when the wind changed to north. As spraying the burning coal with water only made the situation worse, the hottest sections had to be lifted and fed into the boilers. Salt River 1 was fired-up to speed up the process, while generation at Hex River was reduced and coal supplies to Salt River were suspended for 16 days. A rubber-tired bulldozer was purchased to compact coal-heaps to prevent a repeat of the situation (ESCOM Annual Reports 1959:27& 1966:22 and D Fowler 2001).
There was no outdoor high voltage yard and except for the original rural 33 kV distribution line, power was exported from the site via underground cables. Sea water was used for cooling which meant there were no massive cooling towers to intrude on the view. The intake and outfall canals were below road level. The outfall water was discharged on the beach until the harbour extensions in the 1970s and the outfall was then extended below ground level to the breakwater, and now forms part of the Paarden Eiland storm water drainage system. A small quantity of the warmer condenser outlet water was pumped via an underground pipeline for a distance of approximately 1,5 km to the Woodstock swimming baths until these were demolished for the harbour extensions about 1939. (This swimming pavilion is shown on SAR drawing 164-R-2 dated 3-5-1921 (ESCOM drwg. 1.02/2) and stood approximately between the present Lower Church Street exit from the N1 and the Marine Drive exit to Paarden Eiland).
Burman, Jose. Safe to the Sea. Human & Rousseau, Cape Town, 1962
Burman, Jose. Great Shipwrecks off the coast of Southern Africa. Struik, Cape Town, 1968
The Bay of Storms – Table Bay 1503-1860. Human & Rousseau, Cape Town, 1976
Cape Town Mayor’s Minutes (including City Electrical Engineer’s Annual Report), 1908-1910
Christie, R. Electricity, Industry and Class in South Africa. Macmillan, 1984
Commissioners of the Table Bay Harbour Board. The Harbour Works, Table Bay, Cape Colony 1656-1895. Published 1895
Conradie, SR & Messerschmidt, LJM – A Symphony of Power. The Eskom Story. Johannesburg: Chris Van Rensburg Publications (Pty) Ltd. 2000
Dictionary of Business Biography, Volume 4 – edited by David J Jeremy. Butterworths, London 1985
ESCOM/Eskom Annual Reports 1923-1995
ESCOM: Golden Jubilee 1923-1973
ESCOM: Letter from GH Swingler to Dr HJ van der Bijl dated 22 February 1928
Eskom: Statistical Yearbook 1995
ESCOM: Ten Years – A record of the progress and achievements of the Electricity Supply Commission, 1923-1933
ESCOM: Twenty-five Years – A record of the origin, progress and achievements of the Electricity Supply Commission, 1923-1948
General Manager of Railways and Harbours, Annual Reports 1912-1935, (Union Government Annexures presented to Parliament)
Green, Lawrence G – Almost Forgotten, Never Told. Howard Timmins, Cape Town, 1965
Hoy, Sir William – Railway Electrification in South Africa. In: South African Railways and Harbours Magazine, May 1922:355-360
Ingpen, B – South African Merchant Ships. Balkema, Cape Town/Rotterdam, 1979
Kanthack, [Dr] FE – Circulating Water Intake and Discharge Works for the Salt River Power Station. In: The Transactions of the South African Institute of Electrical Engineers, P
Knox-Johnston, R – The Cape of Good Hope – A Maritime History. Hodder & Stoughton, London 1989
Kotze, Sir Robert – Electricity Supply in South Africa. In: South African Railways and Harbours Magazine, May 1922:376-378
Lydall, F – The Electrification of the Pietermaritzburg-Glencoe Section of the South African Railways. In: The Journal of the Institution of Electrical Engineers (London), Vol. 66, 1928, pages 1021 to 1064
Merz and McLellan – South African Railways – Report on the Introduction of Electric Traction, June 1919
Merz and McLellan – Electric Power Supply in the Union of South Africa, April 1920
Mills, FW – Electrification of the South African Railways. In: South African Railways and Harbours Magazine, November 1919:737-738
Palser, D – Lighting Up The Fairest Cape 1895 to 1995. A Historical Record Commemorating the Centenary of the City of Cape Town Electricity Undertaking. (References and quotations by courtesy of the Cape Town City Council Electricity Department)
Pask, TP – The Past and Present in the South African Railways Electrical Department. In: South African Railways and Harbours Magazine, May 1922:420-426
Pask, TP – An Introduction to the Study of Electric Traction in Natal. In: The Transactions of the South African Institute of Electrical Engineers, Vol. XVII, Part 5, May 1926
Picard H – Cape Epic. Khenty Press, Natal 1977
Shorten JR 1963. The City Electrical Engineer’s Department. In: The Golden Jubilee in Greater Cape Town: 303-311. Cape Town: JR Shorten (Pty) Ltd.
South African Who’s Who, Published by Ken Donaldson
Standard Encyclopaedia of Southern Africa
Theal, GMcC – History of South Africa before 1795. Reproduced by Struik, Cape Town 1964
Troost, Dr N & Norman HB, Electricity Supply in South Africa 1909-1969. In: The Transactions of the South African Institute of Electrical Engineers, Sept 1969
Turner M, – Shipwrecks and Salvage in South Africa-1505 to the present. Struik, Cape Town, 1988
van Riebeeck, Jan A – Daghregister/Journal of van Riebeeck. Dutch and English versions, edited by HB Thom, (English translated from the original Dutch by WPL van Zyl, Chief Translator of the House of Assembly). AA Balkema, Cape Town 1952
Veitch N – Waterfront and Harbour. Cape Town’s Link with the Sea. Human & Rousseau, Cape Town 1994