Key performance indicators for Eskom generators are shown below.
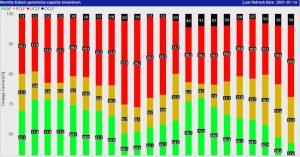
Monthly Eskom Generation capacity breakdown
This is showing the monthly ratio between the available Eskom plant and all unavailabilities (PCLF, UCLF & OCLF) expressed as a percentage.
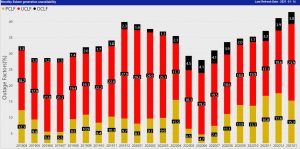
Monthly Eskom Generation unavailability
It is the ratio between the unavailable energy of the units that are off over a month compared to the total net installed capacity of all units over the same month. This is split into the different categories, i.e. PCLF, UCLF and OCLF.
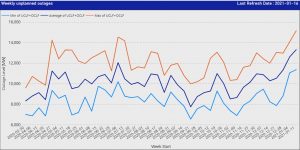
Weekly unplanned outages
This is a trend of the weekly unplanned outages (including other outages) for the current financial year (full weeks are used). It indicates the average trend, as well as showing the spread of these types of outages.
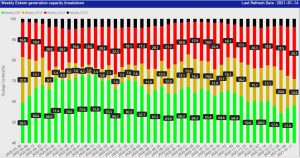
Weekly Eskom Generation capacity breakdown
This is showing the weekly ratio between the available Eskom plant and all unavailabilities (PCLF, UCLF & OCLF) expressed as a percentage.
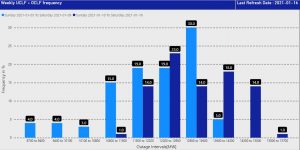
Weekly UCLF+OCLF Frequency
This is showing the frequency that the unplanned outages (including other outages) fall into different groupings for the past 7 days, as well as the 7 days preceding it. It gives a good indication of the spread as well as the behaviour of these types of outages over the respective periods, specifically focusing on recent history.
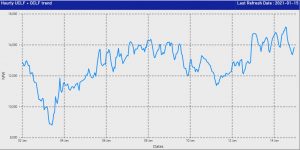
Hourly UCLF+OCLF Trend
This is an hourly trend of the actual unplanned outages (including other outages) for the past 14 days.