The graphics below indicates which resources were required during the past 7 days to balance the supply and demand and to ensure the network stability was maintained.
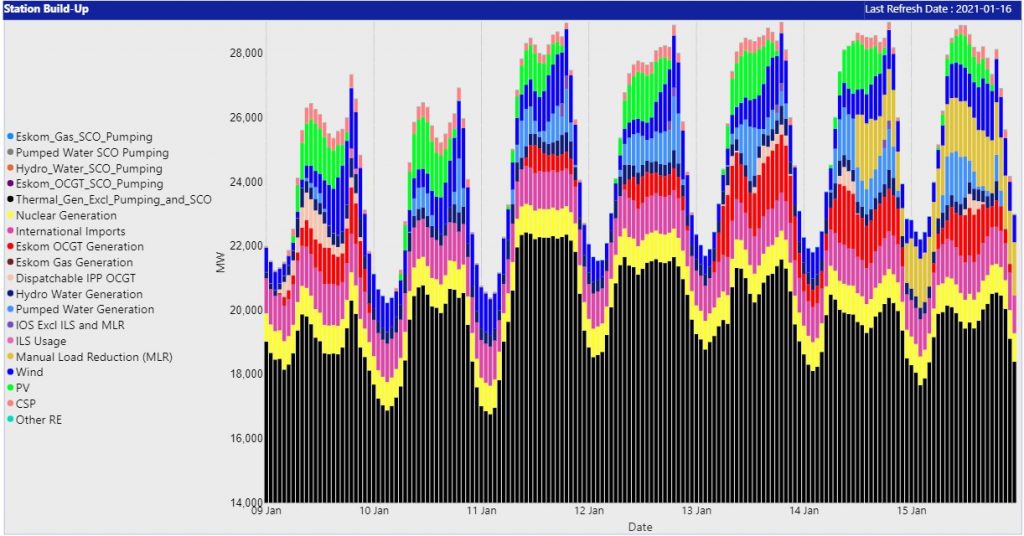
Station build-up for the last 7 days
This shows how resources were used to build-up the demand over the past 7 days, and it includes both generation and demand side resources that Eskom has contracts with.
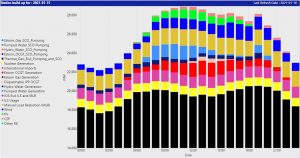
Station build-up for yesterday
This shows how resources were used to build-up the demand yesterday, and it includes both generation and demand side resources that Eskom has contracts with.
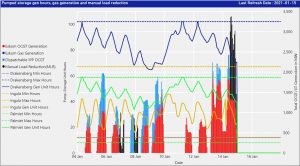
Pumped storage generating hours, gas generation and manual load reduction
The graph below indicates how primary fuel consrained resources where utilized during the past 7 days. Pump storage Gen Unit Hours is the amount of hours that one unit at a pump storage station can generate based on the amount of water still available in the dams. These dams are required to be full at the beginning of each week. Additionally, the manual load reduction is shown.