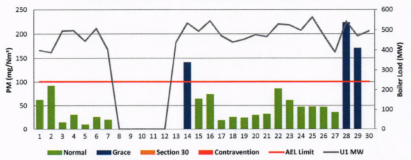
Eskom’s power generation from fossil fuels releases pollutant emissions that include sulphur dioxide (SO2), oxides of nitrogen (NOx), and particulate matter (PM10 and PM2.5).
Dealing with GHGs requires a shift in energy mix to a combination of lower-carbon-emitting technologies, such as renewables, gas, and nuclear. In other words, for Eskom to reduce its absolute emissions of GHGs, it would have to shut down coal plant and replace them with lower or zero GHG emitting plant, which we plan to address with our programme to repurpose power stations aligned with the intent of the “just transition”.
Eskom’s power generation from fossil fuels releases pollutant emissions that include sulphur dioxide (SO2), oxides of nitrogen (NOx), and particulate matter (PM10 and PM2.5). Eskom power stations’ therefore monitor compliance to their emissions limits as set in their Atmospheric Emission Licenses (AEL) on a continuous basis. The emission reports provided are those as submitted to the power stations’ respective licensing authoritys